


Do you want to create a radar chart in Elementor? Radar charts, also known as spider charts or web charts, are powerful visual tools that display multiple data points in a circular format. They are commonly used in business and marketing presentations to showcase comparisons between different variables.
With the Chart widget from The Plus Addons for Elementor, you can easily convert your data into a radar chart on your Elementor website.
To check the complete feature overview documentation of The Plus Addons for Elementor Chart widget, click here.
Requirement – This widget is a part of The Plus Addons for Elementor, make sure it’s installed & activated to enjoy all its powers.
To do this, add the Chart widget to the page and follow the steps –
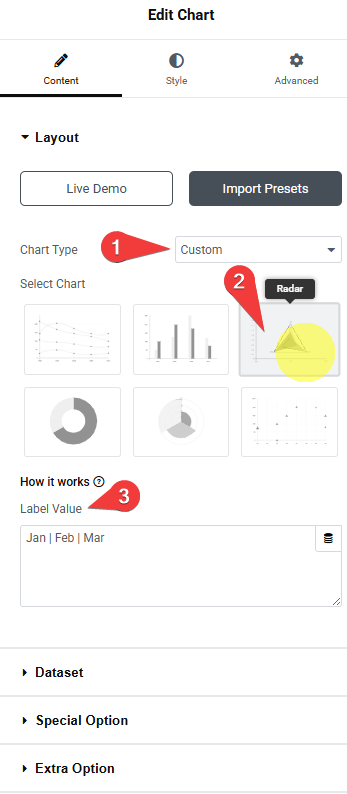
1. You can select Custom from the Chart Type dropdown under the Layout tab.
2. You have to select Radar from the Select Chart section under the Chart tab.
3. After that, in the Label Value field, you have to add chart labels separated by a pipe sign (|).
3. Then, in the Dataset tab, you have to add the data for the chart. You’ll find the same options as for the Line chart.
You can customize the chart further from the Special Option tab. Here you’ll find the same options that are available for the Line chart.
Now you should have a beautiful interactive radar chart.
Suggested Read: How to create a polar area graph in Elementor.